All-in-One Windows Resource Monitoring with PRTG: A Single PowerShell Sensor
As IT professionals, we know the pain of juggling multiple monitoring tools to keep tabs on Windows servers and workstations. CPU spiking? Memory leaking? Disks filling up? Usually, that means deploying separate sensors for each metric in PRTG Network Monitor—or worse, relying on generic WMI queries that flood your console with noise. Honestly, I created this sensor to consolidate resource monitoring in PRTG, freeing up additional sensor licenses.
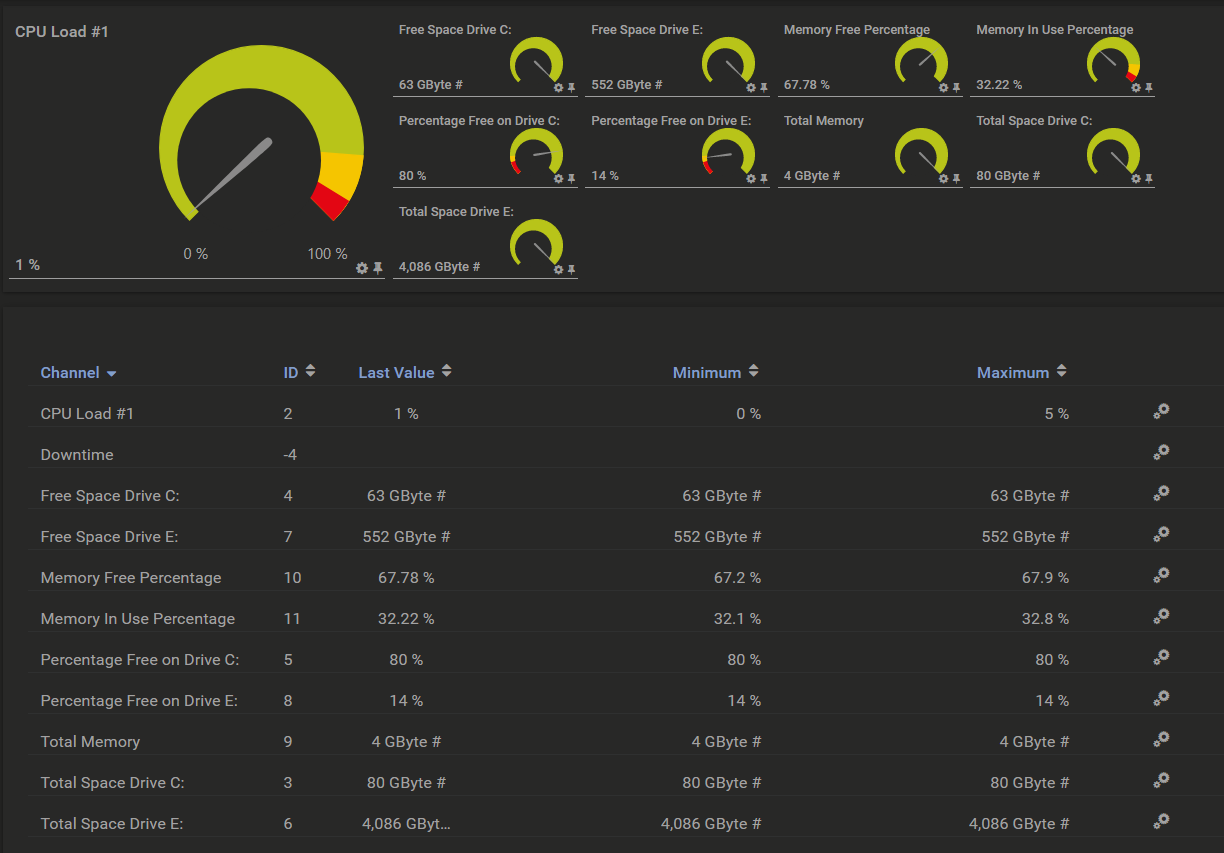
As a result I created Get-ResourceInfoPRTG.ps1—a single, powerful PowerShell script that consolidates CPU, RAM, disk, and network interface monitoring into one custom PRTG sensor. No more sensor sprawl. No more scripting four different EXE/Script sensors. Just drop this script into PRTG and get comprehensive Windows resource insights in a clean, actionable dashboard.
GitHub Repository: Get-ResourceInfoPRTG.ps1

Why I Built This Sensor
PRTG is fantastic out of the box, but when you're managing dozens (or hundreds) of Windows devices, efficiency matters. The built-in sensors are great, but:
- CPU sensor → one sensor
- Memory sensor → another
- Disk sensor per drive → more sensors
Before long, your device tree is bloated, and your PRTG license sensor count is burning through limits.
My goal? One sensor per device that returns all critical resource metrics with proper channels, warnings, and limits—fully compatible with PRTG’s EXE/Script Advanced sensor.
What the Script Monitors
| Category | Metrics Returned | PRTG Channels Created |
|---|---|---|
| CPU | Current utilization (%) | CPU Usage (%) |
| Memory | Used RAM, Available RAM, Total RAM (in GB) | Memory Used (GB), Memory Available (GB) |
| Disk | Per logical disk: Used/Free/Total Space, % Free | One set per disk: C: Free %, C: Free Space (GB), etc. |
All values are returned in PRTG-compatible XML format, so they appear as native channels with graphs, thresholds, and historic data.
How It Works (Under the Hood)
The -UseSSL switch tells PRTG to establish a CIM session via WinRM over HTTPS (TLS) instead of using plain HTTP WinRM.
If you omit -UseSSL, PRTG will attempt a normal WinRM (HTTP) connection (default port 5985).
WinRM over HTTPS uses port 5986 and encrypts the transport with TLS.
Omitting -UseSSL results in a standard HTTP WinRM session (unencrypted transport).
It is fine to use WinRM connections if you have other protections (IPsec, VPN, etc.) in place.
WinRM over HTTPS encrypts all traffic using TLS, providing both confidentiality and integrity. That prevents eavesdropping, tampering, and most on-the-wire credential theft vectors.
Plain HTTP WinRM sends the transport unencrypted. Even though some authentication methods provide protections, the transport itself is not encrypted and is therefore exposed to interception unless you add other protections (IPsec, VPN, or an encrypted layer).
WinRM supports several authentication mechanisms; the security properties differ:
- Kerberos — Best for domain-joined systems. Kerberos authenticates and provides session confidentiality for the payload even if the transport is HTTP; this makes Kerberos + HTTP far safer than NTLM + HTTP. Kerberos requires correct SPNs and DNS/hostname alignment.
- CredSSP — Credential Security Support Provider is an authentication protocol that allows a client to delegate its credentials securely to a target server for remote authentication. It’s commonly used in scenarios like remote desktop (RDP) or WinRM double-hop situations, where the server needs to use your credentials to access a third system. CredSSP encrypts credentials end-to-end and avoids exposing them over the network, making it safer for delegated authentication compared with NTLM or Basic. However, it requires both the client and server to explicitly support and enable CredSSP.
- Negotiate — This option negotiates between Kerberos and NTLM. If Kerberos is available it will be used; otherwise Negotiate falls back to NTLM.
- NTLM — Widely supported but does not provide the same level of protection as Kerberos. NTLM is vulnerable to Pass-the-Hash (PtH) and other credential relay/hijack techniques if credentials or hashes are exposed on an unprotected network.
- Basic — Sends credentials in a form that must be protected by TLS (HTTPS) or another secure transport; avoid using Basic over HTTP.
Using plain HTTP WinRM can be acceptable in limited scenarios where the environment is trusted and isolated, for example:
- Internal lab, test, or staging networks that are never exposed to untrusted hosts.
- When additional network-level encryption is in place (IPsec, an encrypted management VLAN, or a secure VPN endpoint that guarantees confidentiality).
- During short-lived bootstrapping steps where you will quickly switch to HTTPS once certificates are installed.
- When both endpoints are domain-joined and Kerberos is used (still: HTTPS is recommended for defense-in-depth).
Using WinRM over HTTPS should be used when:
- Production environments and any environment that crosses network boundaries (internet, untrusted WAN segments, or multi-tenant networks).
- When using NTLM or Basic authentication — the transport must be encrypted.
- Non-domain or mixed environments where Kerberos is not available.
- When compliance or internal security policies mandate encrypted management channels.
Now that we are using a secure form of WinRM, we utilize it to create a persistent session (a remote CIM/WinRM session) and reuses it for multiple CIM queries/operations. That reduces the cost of repeatedly opening and closing connections and improves performance compared with making a new short-lived connection per operation. The script uses native PowerShell cmdlets—no external dependencies:
# CPU Processors
$CPUs = Get-CimInstance -ClassName "Win32_Processor"

# Memory
$OS = Get-CimInstance Win32_OperatingSystem
$TotalMemory = ($OS.TotalVisibleMemorySize * 1KB)
$MemoryFreePercentage = [Math]::Round(($OS.FreePhysicalMemory/$OS.TotalVisibleMemorySize)*100,2)
$MemoryInUsePercentage = [Math]::Round(100-(($OS.FreePhysicalMemory/$OS.TotalVisibleMemorySize)*100),2)

# Disks
$Disks = Get-CimInstance -ClassName "Win32_LogicalDisk" -Filter "DriveType=3"
It then builds a PRTG XML response like this:
PRTG Custom Sensor Documentation Reference
<prtg>
  <result>
    <channel>CPU Usage (%)</channel>
    <value>32.5</value>
    <unit>Percent</unit>
    <limitmode>1</limitmode>
    <limitmaxwarning>80</limitmaxwarning>
    <limitmaxerror>90</limitmaxerror>
  </result>
  <!-- More channels for RAM, disks, NICs -->
</prtg>
This ensures full PRTG integration: thresholds, alerts, historic graphs, and map objects.
How to Deploy in PRTG
- Download the script from GitHub:
Get-ResourceInfoPRTG.ps1 - Place it on your PRTG probe (local or remote) in a folder like:
C:\Program Files (x86)\PRTG Network Monitor\custom sensors\exe\ - In PRTG Web Interface:
- Add Sensor → EXE/Script Advanced
- Select
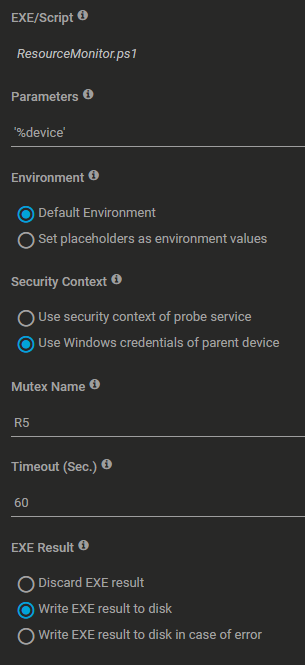
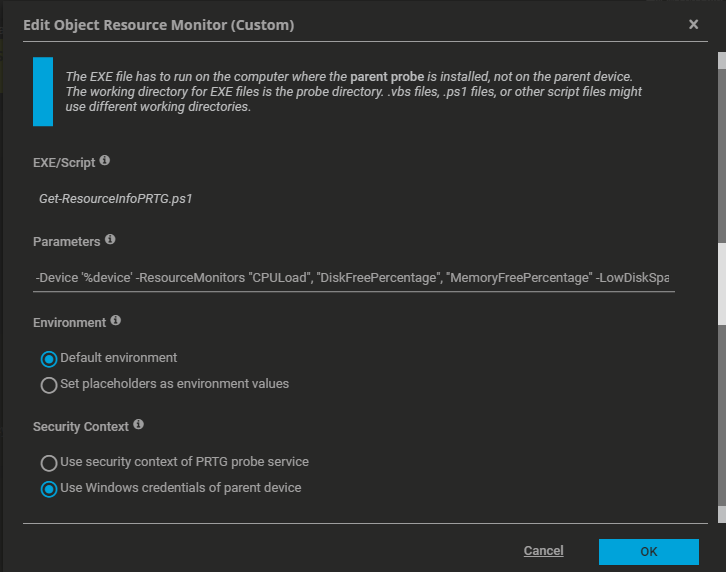
Get-ResourceInfoPRTG.ps1 - Set Execution Timeout to 60 seconds
- (Optional) Pass parameters like:
- Done! One sensor now monitors everything.

Pro Tip: Use sensor inheritance or auto-discovery with a parent device template to roll this out to 100+ servers in minutes.
Customizable Thresholds (via Parameters)
You can select which resources you want to include in the monitoring as well as override defaults directly in the sensor:
-ResourceMonitors "CPULoad", "CPUCount", "DiskFreePercentage", "DiskFreeGigabytes", "TotalDisks", "MemoryFreePercentage", "MemoryFreeGigaByte" -LowDiskSpaceWarningThreshold 20 -LowDiskSpaceCriticalThreshold -CpuUsageWarningThreshold 85 -CpuUsageCriticalThreshold 95 -MemoryWarningThreshold 85 -MemoryCriticalThreshold 95 -IgnoreWarningMessage -UseSSL
This sets the below values:
- CPU warning at 75%, error at 90%
- Memory warning at 85% used
- Disk warning when <15% free
Example Output in PRTG
After deployment, your sensor will show channels like:
CPU Usage (%)                28.4
Memory Used (GB)             12.3
Memory Available (GB)         3.7
C: Free Space (%)            42.1
C: Free Space (GB)          105.4
Ethernet: Bytes Sent/sec   12450
Ethernet: Bytes Recv/sec   89320
And you’ll get beautiful historic graphs for each.
Real-World Use Cases
- Server Health Dashboard: One map object showing CPU, RAM, and critical disk for each host.
- License Optimization: Reduce sensor count by 70%+ on Windows fleets.
- Proactive Alerts: Get notified before disks fill or memory leaks crash services.
- Remote Probe Ready: Works perfectly on core or remote probes via WinRM or local execution.
Future Enhancements (PRs Welcome!)
- Add process-level CPU hogs (top 5 processes)
- Include page file usage
- Support SNMP fallback for non-PowerShell devices
- Add JSON output mode for non-PRTG use
Contributions welcome! Fork it on GitHub and submit a pull request.
Get It Now
Download Get-ResourceInfoPRTG.ps1
Star the Repo to show support!
Final Thoughts
Monitoring doesn’t have to be complicated. With this script, you get enterprise-grade Windows resource visibility using one PRTG sensor. Less noise. More insight. Faster response.
Try it today and let me know how many sensors you retired!
Have feedback or ideas? Open an Issue in GitHub.
Tags: PRTG, PowerShell, Windows Monitoring, Custom Sensors, IT Automation, DevOps, SysAdmin
Published: November 09, 2025
Author: Robert H. Osborne

